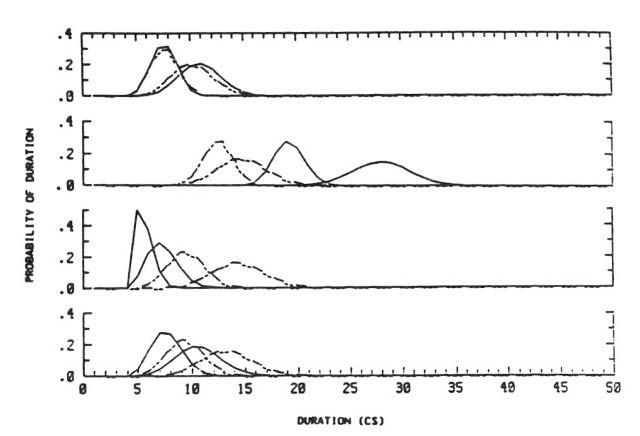
 Figure 8. Modeled durations for states 1 (top) - 4 (bottom) of words
tee:de (solid line) and teete (dashed line). For each state of each
word, the broad pdf to the right models the expanded range of durations
for the training productions. The narrow pdf to the left was derived in
post hoc modeling of the 4 s/pair test productions. Notice in the
curves for state 3, that the average duration of state 3 of teete in the
fast speech is closer to that of state 3 of tee:de in the slow speech
than to that of teete in the slow speech. Of course, our vocabulary was
chosen so that these kinds of duration confusions would occur across
speech rate.
Figure 8. Modeled durations for states 1 (top) - 4 (bottom) of words
tee:de (solid line) and teete (dashed line). For each state of each
word, the broad pdf to the right models the expanded range of durations
for the training productions. The narrow pdf to the left was derived in
post hoc modeling of the 4 s/pair test productions. Notice in the
curves for state 3, that the average duration of state 3 of teete in the
fast speech is closer to that of state 3 of tee:de in the slow speech
than to that of teete in the slow speech. Of course, our vocabulary was
chosen so that these kinds of duration confusions would occur across
speech rate.
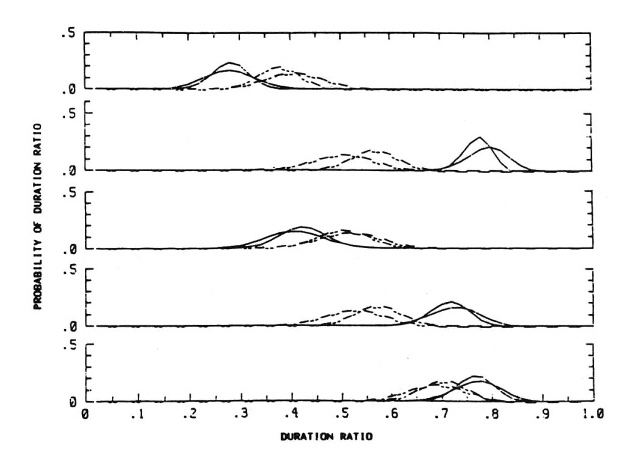 Figure 11. State duration ratio pdf's P(ratio |w), from top to bottom,
for ratios 1/(1 + 2), 2/(2 + 3), 3/(3 + 4), and (2 + 3)/(2 + 3 + 4), and
words tee:de (solid line) and teete (dashed line). For each ratio, the
broad pdf models the expanded range of durations of the training
productions. The narrow pdf is the one derived in post hoc modeling of
the 4s/pair test productions.
It is important to notice the congruence of the duration ratio pdf's
over speech rate. These duration ratio pdf's are obviously much more
invariant over speech rate than are the duration pdf's of Figure 8.
Figure 11. State duration ratio pdf's P(ratio |w), from top to bottom,
for ratios 1/(1 + 2), 2/(2 + 3), 3/(3 + 4), and (2 + 3)/(2 + 3 + 4), and
words tee:de (solid line) and teete (dashed line). For each ratio, the
broad pdf models the expanded range of durations of the training
productions. The narrow pdf is the one derived in post hoc modeling of
the 4s/pair test productions.
It is important to notice the congruence of the duration ratio pdf's
over speech rate. These duration ratio pdf's are obviously much more
invariant over speech rate than are the duration pdf's of Figure 8.
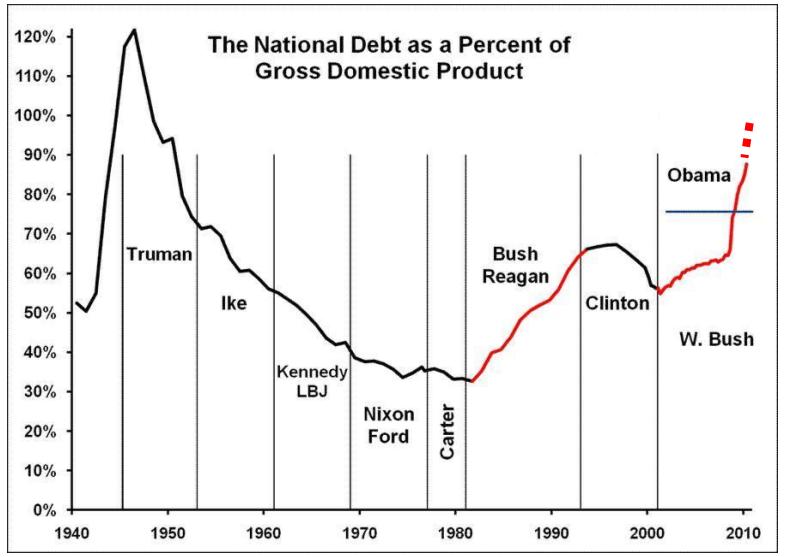 Figure 1. U.S. national debt as a percentage of GDP. Source:
zFacts.com. The dotted extrapolation through the end of 2010 is based
on an estimate from the White House.
Figure 1. U.S. national debt as a percentage of GDP. Source:
zFacts.com. The dotted extrapolation through the end of 2010 is based
on an estimate from the White House.
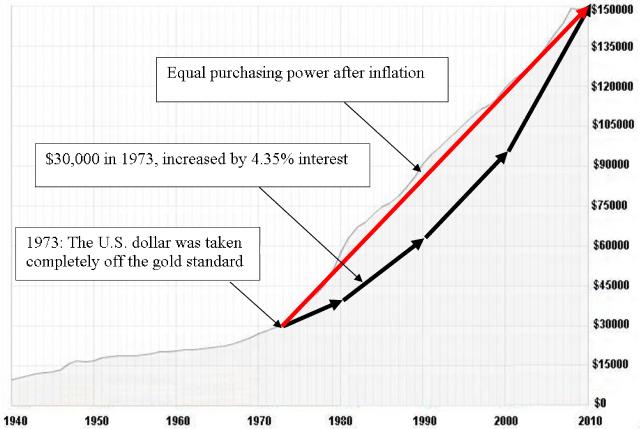 Figure 4. In 1973, the U.S. dollar was taken off gold and inflation
tilted upward. The purchasing power of $30,000 in 1973 is the same as
$150,000 in 2010. Source: USA Today.
Figure 4. In 1973, the U.S. dollar was taken off gold and inflation
tilted upward. The purchasing power of $30,000 in 1973 is the same as
$150,000 in 2010. Source: USA Today.
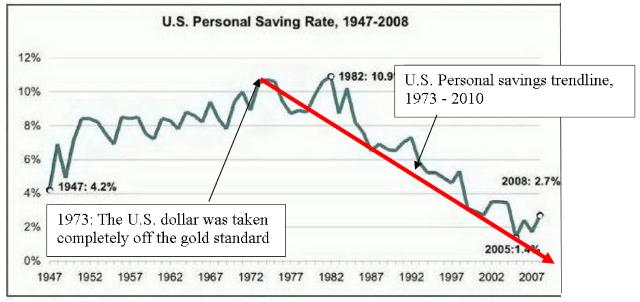 Figure 5. How the U.S. personal savings rate of 1973 compares to
today. Source: Business Insider.
Figure 5. How the U.S. personal savings rate of 1973 compares to
today. Source: Business Insider.
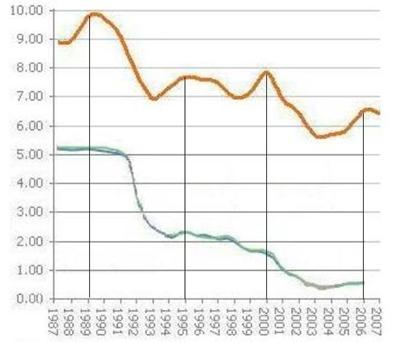 Figure 7. Average contract mortgage interest rate (top) vs passbook
and statement savings interest rate (bottom), 1987 - 2006. The
mortgage-to-savings interest-rate ratio increases from 2:1 in 1989, to
3:1 in 1995, to 4:1 in 2000, to 13:1 in 2006. Sources: mortgage-x.com,
bankrate.com.
Does this increasing ratio of interest-earned to interest-paid-out help
explain why bankers and the finance industry were increasingly eager to
market mortgages before the current recession?
Figure 7. Average contract mortgage interest rate (top) vs passbook
and statement savings interest rate (bottom), 1987 - 2006. The
mortgage-to-savings interest-rate ratio increases from 2:1 in 1989, to
3:1 in 1995, to 4:1 in 2000, to 13:1 in 2006. Sources: mortgage-x.com,
bankrate.com.
Does this increasing ratio of interest-earned to interest-paid-out help
explain why bankers and the finance industry were increasingly eager to
market mortgages before the current recession?
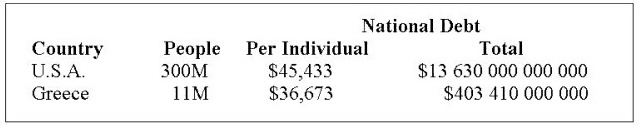 Table 1. Statistics suggest that the U.S. has 27 times more people than Greece,
24% more national debt on average per person, and 34 times more national debt in total.
Table 1. Statistics suggest that the U.S. has 27 times more people than Greece,
24% more national debt on average per person, and 34 times more national debt in total.
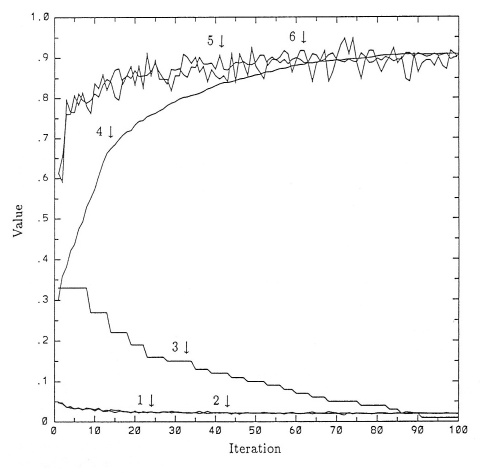 Figure 1. A network with 652 parameters is trained
in 100 iterations through the data.
Figure 1. A network with 652 parameters is trained
in 100 iterations through the data.
 Figure 17.2 Features and feed-forward sensitivites for
poorly-discriminated training examples
Figure 17.2 Features and feed-forward sensitivites for
poorly-discriminated training examples
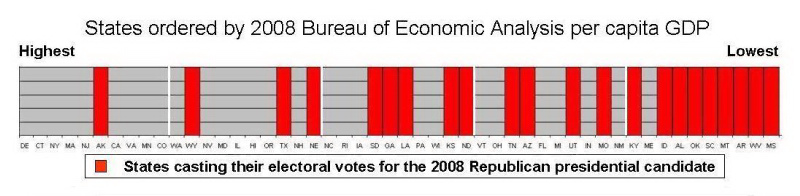 Figure 1. States ordered by 2008 Bureau of Economic Analysis per capita GDP.
Comments:
AMEN!!! TD, May 25, 2009
Interesting, very GKuhn-like data. But the question you allow yourself
to ask is not exciting. There is a conclusion that is begging to be
made from this, and I wish I knew what it is. SJ, May 26, 2009
Indeed, the graph is very interesting. As you say, causality is another
matter, but one is tempted to make a connection: low GDP -> low
education -> conservative religious -> Republican. I may be perfectly
wrong, or a victim of some prejudice. PI, May 26, 2009
Figure 1. States ordered by 2008 Bureau of Economic Analysis per capita GDP.
Comments:
AMEN!!! TD, May 25, 2009
Interesting, very GKuhn-like data. But the question you allow yourself
to ask is not exciting. There is a conclusion that is begging to be
made from this, and I wish I knew what it is. SJ, May 26, 2009
Indeed, the graph is very interesting. As you say, causality is another
matter, but one is tempted to make a connection: low GDP -> low
education -> conservative religious -> Republican. I may be perfectly
wrong, or a victim of some prejudice. PI, May 26, 2009

 Figure 1. Statistics for 50 US states and Washington DC.
Left: K-12 education rankings, source: US Chamber of Commerce, 2007.
Right: Health-care scores, source: United Health Foundation, 2008,
graphed by Time Magazine.
Figure 1. Statistics for 50 US states and Washington DC.
Left: K-12 education rankings, source: US Chamber of Commerce, 2007.
Right: Health-care scores, source: United Health Foundation, 2008,
graphed by Time Magazine.


 Figure 1. Left: the original 3x3x3 cube. Middle: the 3x3x3 cube for the visually handicapped.
Right: the 2x2x2 cube that looks like Homer Simpson
Figure 1. Left: the original 3x3x3 cube. Middle: the 3x3x3 cube for the visually handicapped.
Right: the 2x2x2 cube that looks like Homer Simpson
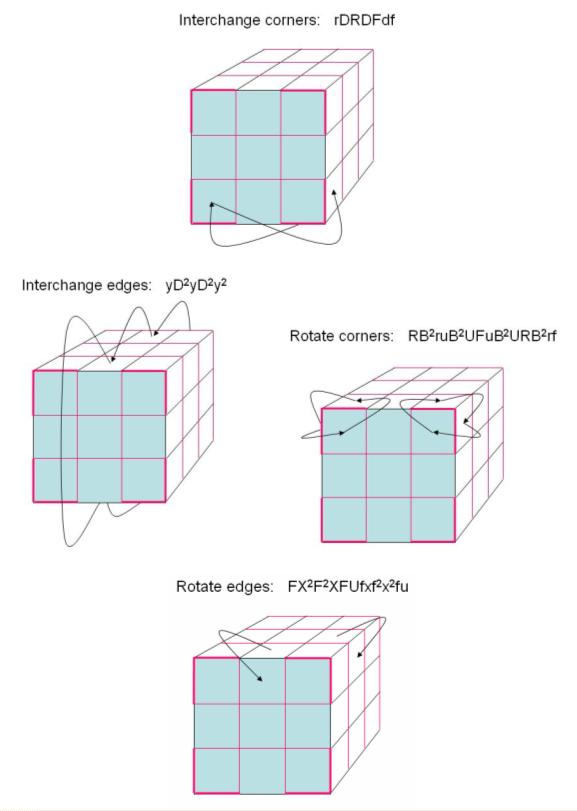 Appendix A. All four moves. Details in the paper.
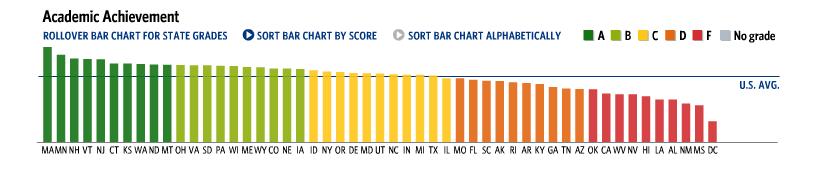 Figure 1. The score (height) and grade (color) for K-12 education in 50 US states
and Washington DC. Source: US Chamber of Commerce, 2007.
Figure 1. The score (height) and grade (color) for K-12 education in 50 US states
and Washington DC. Source: US Chamber of Commerce, 2007.
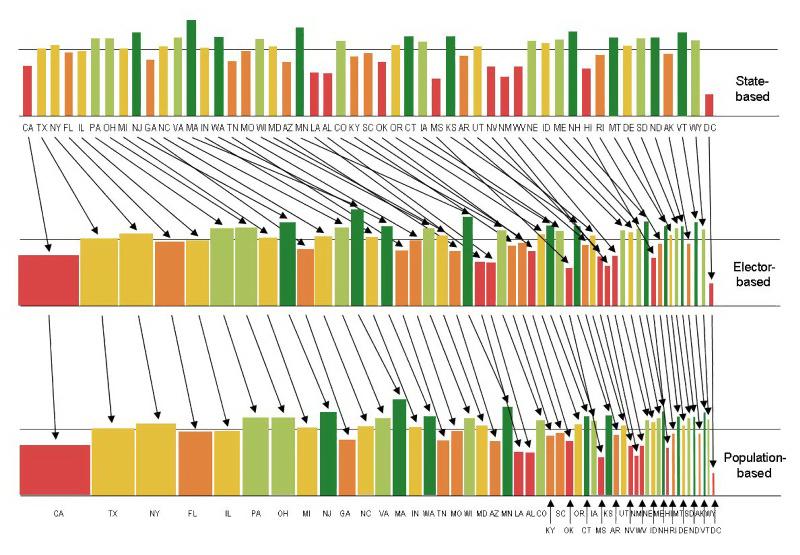 Figure 4. The scored (height) and graded (color) US states plus Washington DC,
ordered by population (left-to-right) and with width proportional to representation
(top) in the US Senate, (middle) by US presidential electors, or (bottom) in the US
House of Representatives.
Why do the people in the 21 most populous states (thru Minnesota, MN) get 93% of the
presidential electors that they should have by population?
Why do the people in the 29 least populous states plus Washington DC (starting with
Louisiana, LA) get 129% of the presidential electors that they should have by
population?
Why does the 68% of the US population that lives in the 16 most populous states (thru
Tennessee, TN) only get 32% of the vote in the US Senate?
Why do the 103 million people in the five most populous states (CA, TX, NY, FL and IL)
have an average K-12 education grade of D+?
In the US federal system, does under-representation of the people in the most populous
states produce an insensitivity to their population-based needs such as education?
Figure 4. The scored (height) and graded (color) US states plus Washington DC,
ordered by population (left-to-right) and with width proportional to representation
(top) in the US Senate, (middle) by US presidential electors, or (bottom) in the US
House of Representatives.
Why do the people in the 21 most populous states (thru Minnesota, MN) get 93% of the
presidential electors that they should have by population?
Why do the people in the 29 least populous states plus Washington DC (starting with
Louisiana, LA) get 129% of the presidential electors that they should have by
population?
Why does the 68% of the US population that lives in the 16 most populous states (thru
Tennessee, TN) only get 32% of the vote in the US Senate?
Why do the 103 million people in the five most populous states (CA, TX, NY, FL and IL)
have an average K-12 education grade of D+?
In the US federal system, does under-representation of the people in the most populous
states produce an insensitivity to their population-based needs such as education?
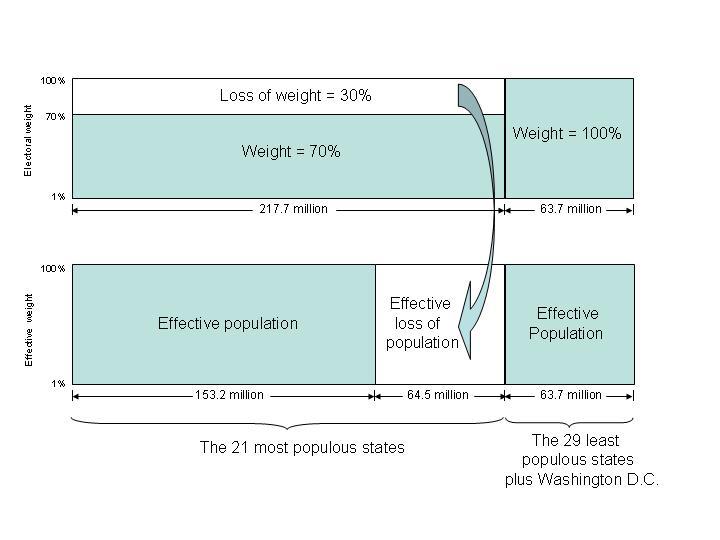 Figure 1. The 21 most populous U.S. states get 70.6% of the U.S. presidential electors
for their 77.4% of the U.S. population, a down-weighting to 91.3%. The 29 least populous
states plus Washington DC get 29.4% of the electors for their 22.6% of the population,
an over-weighting to 129.7%. The ratio of 91% to 129% is 70%. In other words, if the
weighting of people in the 29 least populous states plus Washington DC is the unit of
comparison, the people in the 21 most populous states are down-weighted by 0.70, with an
effective loss of population of 64 million people, a loss of more people than
exist in the rest of the country.
Figure 1. The 21 most populous U.S. states get 70.6% of the U.S. presidential electors
for their 77.4% of the U.S. population, a down-weighting to 91.3%. The 29 least populous
states plus Washington DC get 29.4% of the electors for their 22.6% of the population,
an over-weighting to 129.7%. The ratio of 91% to 129% is 70%. In other words, if the
weighting of people in the 29 least populous states plus Washington DC is the unit of
comparison, the people in the 21 most populous states are down-weighted by 0.70, with an
effective loss of population of 64 million people, a loss of more people than
exist in the rest of the country.
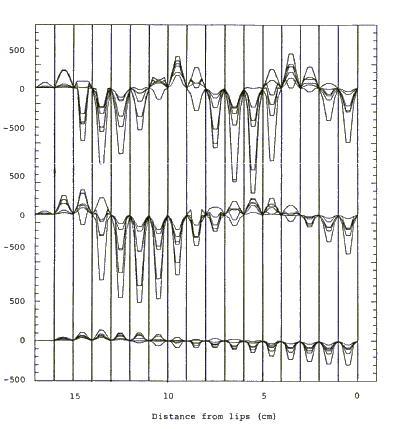 Figure 5. Formant transitions superimposed, /V - constriction - V/.